Azure Migrate is a Central hub for all the cloud migration activities. This is the third post of the series of posts regarding the Azure Migrate where you can shift your workloads to Azure. From the first post, Azure Migrate | Hub for all thing’s migration, I have covered the introduction and architecture of Azure Migrate technology. From Azure Migrate | Installing and Configuring Server Assessment tool post I have discussed step by step on installing and configuring the Server Assessment tool.
After implementing the server assessment tool, you must create assessments. Server Assessment is to identify the appropriate data point to use for right-sizing, based on the percentile values for Performance history and Percentile utilization. From this post lets discuss how to run an assessment according to your migration requirement.
There are two types of assessments you can perform through Azure Migrate
- Performance-based
When performance-based is selected, the assessment will be based on collected performance data. Recommended VM sizing will consider the CPU and memory utilization of the existing environment. The recommended disk type also will be based on the IOPS and throughput of the on-premises disks.
- As On-premises
This will not consider the current utilization, it will be based on the allocated resources for the on-premise environment. Recommended VM sizing will be based on the on-premise VM size and the Recommended disk type will be the setting you select in the assessment.
Before running an assessment, your Server Assessment tool should be ready to use. Please go through on my previous post on installing and configuring Server Assessment tool with a migrate project.
When Performance-based is selected, the server assessment tool will collect real-time performance data from VM’s and Servers. If you have installed VMware Assessment Appliance, it will collect real-time performance data at 20-second intervals, when it's Hyper V, it collects 30-second intervals, on physical, it usually collects 5 minutes at a time. With these data, the appliance creates a single data point every 10 minutes. It selects the peak value from all the samples, and then sends it to Azure.
These data are available in Azure to create the assessments when the assessment is created, it will identify the appropriate data point to use for right-sizing based on the percentile values for Performance history and Percentile utilization. For example, if the performance history is set to one week, and the percentile utilization is the 95th percentile, Server Assessment sorts the 10-minute sample points for the last week in ascending order and picks the 95th percentile value for right-sizing.
Next, this generated value will be multiplied by the Comfort Factor, Comfort factor represents a buffer used during the assessment. It will get the effective performance utilization data for each metric CPU utilization, memory utilization, disk IOPS (read and write), disk throughput (read and write), and network throughput (in and out) that the appliance collects.
Here are some important configurations required when creating assessments.
- Performance history Used with performance-based sizing. Specify the duration used when evaluating performance data.
- Percentile utilization Used with performance-based sizing. Specifies the percentile value of the performance sample to be used for right-sizing.
- VM series Specify the Azure VM series that you want to consider for right-sizing. For example, if you don't have a production environment that needs A-series VMs in Azure, you can exclude A-series from the list or series.
- Comfort factor Buffer used during the assessment. Applied on top of machine utilization data for VMs (CPU, memory, disk, and network). It accounts for issues such as seasonal usage, short performance history, and likely increases in future usage.
For example, a 10-core VM with 20% utilization normally results in a two-core VM. With a comfort factor of 2.0x, the result is a four-core VM instead.
Create Assessment
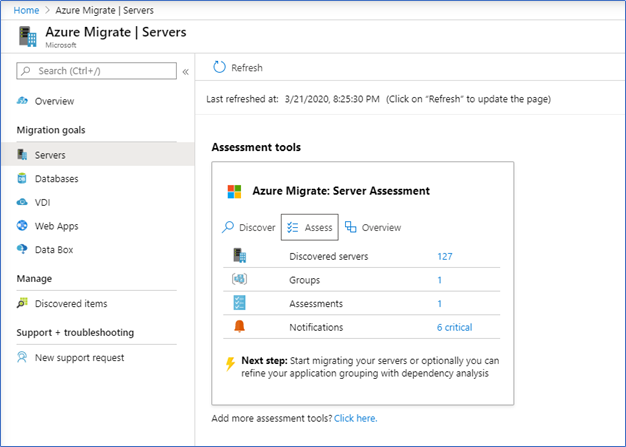
- When the server assessment appliance installed and it starts collecting data, you can see resources being discovered in your Azure migrate project. Click Assess to access Assessment
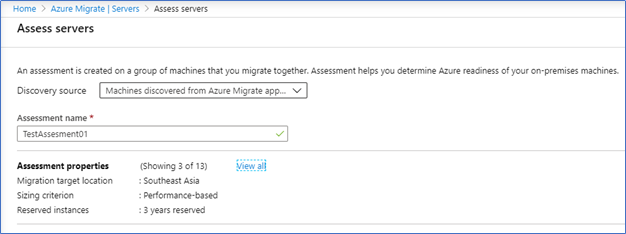
- Select the discovery source as Azure Migrate appliance and Name the assessment. Then click View all
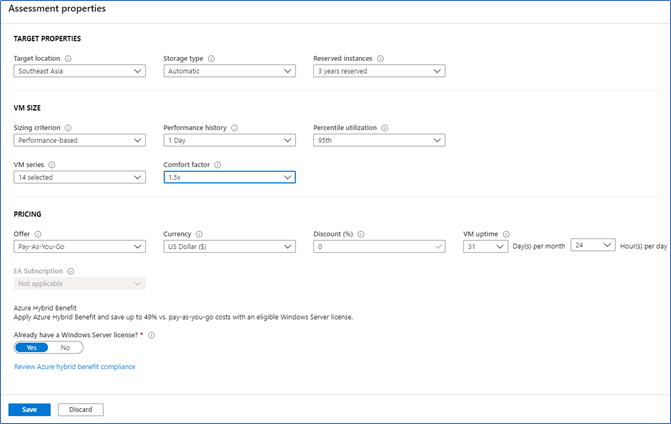
- In View All, there are some important configurations for the assessment,
Target properties – first you need to select the target location, costing may vary according to this. Next Storage type, here I’m letting assessment data to decide that. Reserve instances will have an impact on your VM pricing.
VM Size – first you can decide performance-based or on-premise based, this I have discussed earlier in this post. Performance history refers to the duration which will consider the on-premise performance data. Percentile utilization Specifies the percentile value of the performance sample to be used for right-sizing. The comfort factor refers to the buffer used during the assessment.
Pricing – this has many configurations such as Microsoft Azure Offer, any Discount you get from Microsoft, Currency and VM uptime
Hybrid Benefit – if you have Windows Server Software Assurance or Windows Server subscriptions, you can bring that license to Azure and use the Hybrid benefits.
Here I’m using Performance-based, 30 days of performance history, 95th percentile utilization and 1.5 comfort factor. This means if my performance avg shows 4 cores of CPU required, my assessment will require an additional 0.5, which will result in 6 cores. I hope you understand.
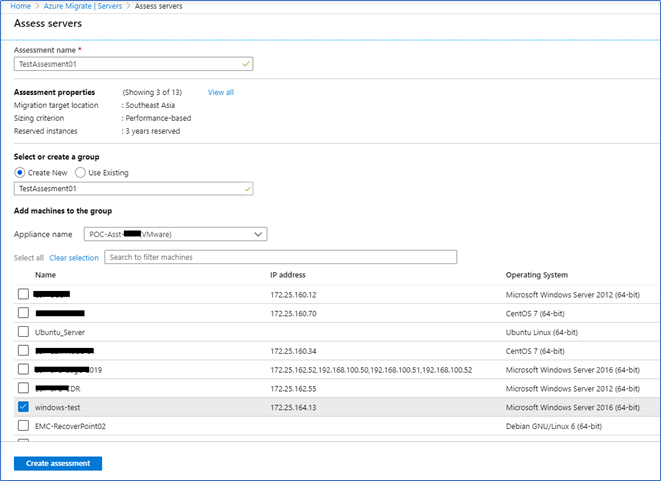
- Next, select Create new group, name it, and select the servers which included in the assessment and click Create Assessment
View Assessments
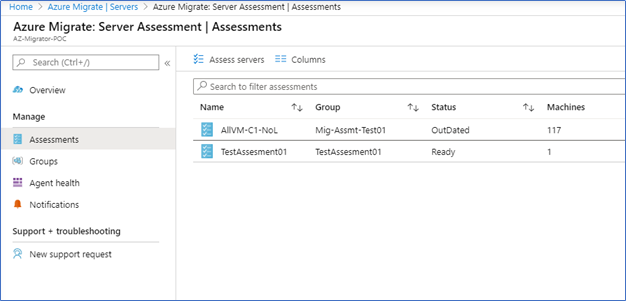
- You can view the assessment by Azure Migrate - Servers – Overview – Assessments
- You can export the assessment to an excel using Export assessment
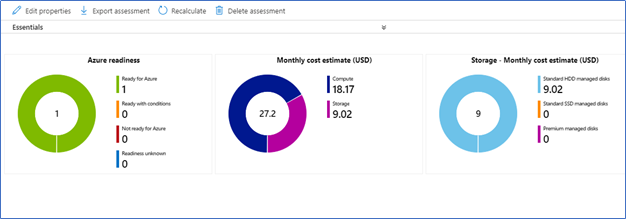
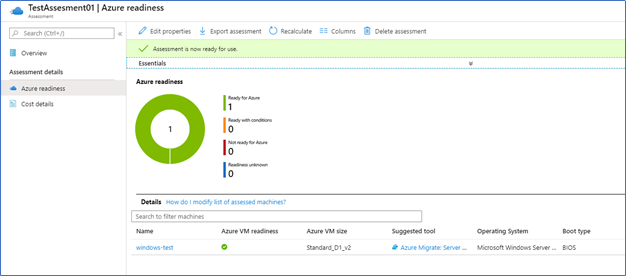
- Click to see Azure readiness
- To get the cost estimation clicking Cost details
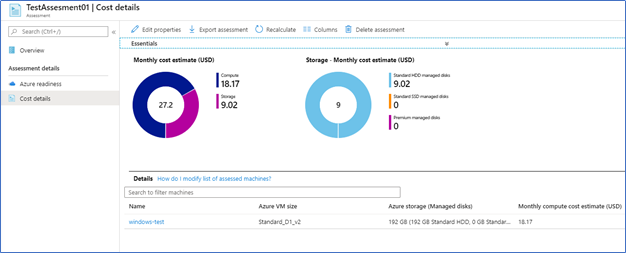
With this output of assessment, you can identify the Azure VM readiness, Monthly cost estimate, Storage costs, etc. Also, it will provide the direction for the migration. If your assessment report suggests or you have understood how complex is your workload, you can proceed to a dependency analysis.
Dependency analysis helps you to identify and understand dependencies across machines you want to assess and migrate to Azure. There are many tools to support dependency mapping. With Azure Migrate, you can use Azure Log analytics. Log analytics agent needs to be installed in each server, Log analytics workspace will identify dependencies and provide the visualization. Thus, it’s a separate topic so I will discuss it in a separate post.
However, if you don’t have complex workloads and assessments suggest using the lift & shift method, you can use the Azure Migrate: Server Migration (Replication) tool to migrate the servers. From my next post, let's discuss how to implement the Azure migrate: Server Migration Tool and do a lift & shift of a workload assessed by this assessment.
Hope this post is useful
Cheers
Asitha De Silva
