Applications are inherently complex in today's technology landscape. Most organizations have adopted microservices architectures, moving away from monolithic applications. With microservices, developers work with multiple programming languages, frameworks, and database technologies while integrating various components like Kafka, third-party vendors, and external APIs. This complexity presents a significant challenge. Development and product teams strive to accelerate delivery and scale applications efficiently to reach customers quickly while ensuring production stability. When issues arise, rapid identification and resolution are essential. The ideal scenario is detecting and remedying potential failures before they impact customers. This is where application observability and monitoring play a crucial role. By implementing robust observability solutions, teams can gain real-time insights into system performance, detect anomalies early, and ensure a seamless user experience.
Benefits of Application Monitoring
Observing your applications helps you understand their health, which leads to improved performance and availability for end users. This proactive approach can indirectly reduce operational costs by providing clear insights into what needs attention rather than treating your application as a black box. It also enhances the end-user experience by enabling you to identify and fix issues before customers are affected, ensuring overall customer satisfaction.
Amazon CloudWatch
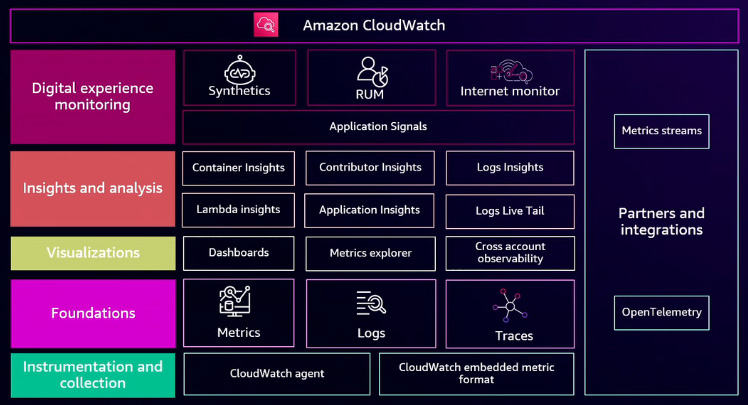
Amazon CloudWatch is AWS's native observability solution, integrating with AWS services and open-source tools. It provides a comprehensive way to monitor and manage application performance. A key enhancement in AWS observability is the Unified CloudWatch Agent, introduced recently. Previously, sending different types of telemetry data required multiple agents, one for metrics, another for logs, and yet another for traces. This fragmented approach added complexity. With the Unified CloudWatch Agent, a single agent handles all three, including metrics, logs, and traces, eliminating the need for multiple installations and configurations. This streamlines observability by consolidating all signals into Amazon CloudWatch. With Amazon CloudWatch, you can create custom dashboards using CloudWatch itself or Metric Explorer. If you manage multiple AWS accounts, you can designate one as a monitoring account to enable cross-account observability. Beyond basic monitoring, AWS provides deeper insights into different environments. Container Insights allows you to monitor containerized applications, Lambda Insights helps analyze AWS Lambda function performance, and Log Insights enables efficient log data analysis. These specialized tools help you understand how your infrastructure is behaving. AWS also offers Application Signals, a structured approach to Application Performance Monitoring (APM). This integrates with AWS services like synthetic monitoring (Canaries) and real user monitoring (RUM). Instead of navigating multiple dashboards, you can diagnose application issues from a centralized interface with just a few clicks. You can also access Metric Streams, which allow you to send metrics or logs to third-party tools or on-premises environments. Also, all these observability features are built on OpenTelemetry, ensuring compatibility with open standards.
Key Application Monitoring Metrics
In Application Performance Monitoring (APM), RED metrics are key performance indicators: R stands for requests, E for errors and faults, and D for duration or latency. These are considered the golden signals of APM. Application Signals in AWS is built around these RED metrics, providing a centralized view where you can monitor all these critical performance indicators from a single location.
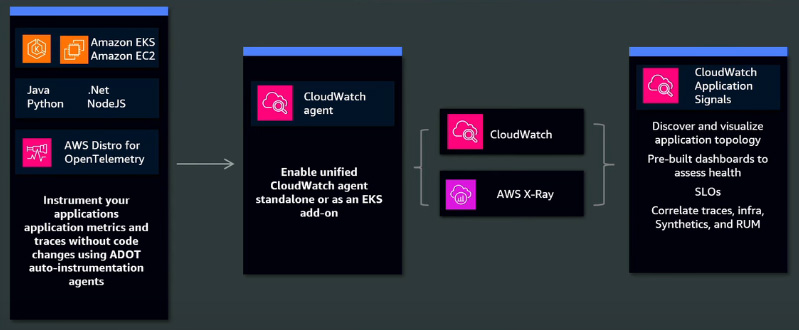
On the left-hand side, you have Application Signals, which leverage OpenTelemetry, ensuring you don't have to worry about vendor lock-in. Since OpenTelemetry is based on open standards from the Cloud Native Computing Foundation (CNCF), the organization that maintains Kubernetes, Prometheus, and Grafana, it provides a standardized and vendor-neutral approach to observability. Application Signals is fully built on OpenTelemetry, offering seamless integration with existing cloud-native tools. Furthermore, the system supports four programming languages, including Java, Python, .NET, and Node.js. If you use any of these, you don't need to write a single line of code for instrumentation; OpenTelemetry's auto-instrumentation will handle it. From the computing perspective, it supports EC2, ECS, EKS, and even on-premises Kubernetes or alternative distributions like ROSA. For example, if you run a Java application on EKS, you simply enable an add-on, and everything works. The Unified CloudWatch Agent is a single agent responsible for collecting and forwarding metrics, logs, and traces. Metrics and logs are sent to CloudWatch, while traces are sent to AWS X-Ray. Further, Application Signals provides an out-of-the-box dashboard where you can correlate metrics, logs, and traces in one place, define Service Level Objectives (SLOs), and gain deeper insights into your application's performance.
If you implement these observability practices correctly, key steps include collecting telemetry, discovering services, troubleshooting with metrics and traces, setting service-level objectives, and integrating synthetic and client monitoring.
Collect Telemetry
In this context, telemetry refers to the collection of metrics, logs, and traces from your applications. Since it is built on OpenTelemetry, which follows open standards, it ensures compatibility and seamless integration. Also, it ensures backwards compatibility with AWS X-Ray. If you are already using X-Ray, your existing traces will be automatically converted into spans without requiring modifications. With the Unified CloudWatch Agent, you can reduce the number of agents running across your environment while maintaining backward compatibility. This means you don't need to make any code changes for these observability enhancements to take effect.
Discover Services
In a microservices environment, you don't need to track which microservice is calling another manually. For example, Microservice A communicates with Microservice B. By default, the telemetry signals you send allow the system to correlate data and dynamically generate service maps automatically. Also, you can gain deeper insights into how these services operate under the hood in the Services View.
Troubleshooting with Metrics and Trances
When an issue occurs in your production environment, diagnosing and fixing it is straightforward. With just a few clicks in the UI, you can analyze anomalies detected in the metrics graphs. By drilling down into transaction details using traces, you can quickly identify the root cause. The system will even show the exact line number where the failure occurred.
Set Service Level Objectives (SLO)
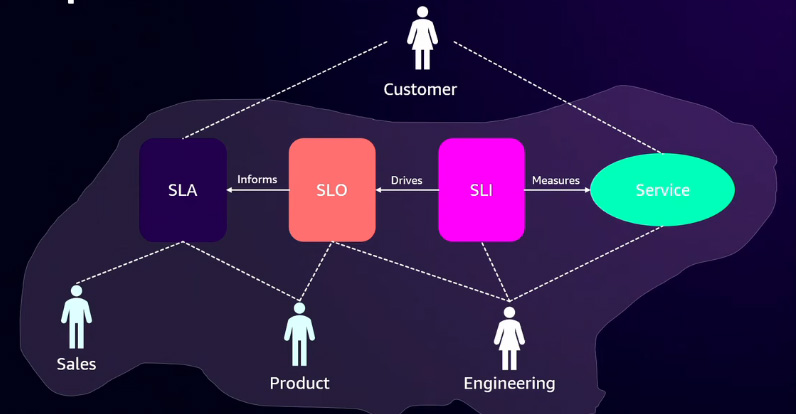
In observability, the metrics your services generate are known as Service Level Indicators (SLIs). These SLIs serve as the foundation for Service Level Objectives (SLOs), which define performance targets, such as 99% availability. SLOs, in turn, inform Service Level Agreements (SLAs). Each of these metrics is relevant to different stakeholders. Engineering teams monitor SLIs to track service health, while product managers use SLOs to set performance expectations (e.g., "Our service is available 99% of the time"). Meanwhile, sales teams communicate SLAs to customers, specifying guarantees and any penalties for non-compliance, often in the form of monetary compensation. This structured approach ensures accountability across technical and business teams.
Suppose you define an SLO, stating that your service must be 99% available over a one-month period. To calculate this, consider that a month has 43,800 minutes. With 99% availability, the remaining 1% (438 minutes, or roughly 7 hours and 18 minutes) represents your error budget, the maximum allowable downtime before the SLO is breached. If downtime exceeds 7 hours, 18 minutes, and even one second, the SLO is considered violated. To proactively address this, you can set up alerts using CloudWatch Alarms to notify SREs so they can take immediate action. Traditionally, teams relied on spreadsheets and custom scripts to calculate SLIs and SLOs. However, with Application Signals, you can define and monitor these metrics with just a few clicks.
Synthetics and Client Integrations
With integrated synthetic and real user monitoring (RUM), you can track simulated and actual user experiences from a single platform. Synthetic monitoring helps ensure your applications and websites remain operational. By running canary tests, you can continuously check for availability and functionality. If a canary test fails, alerts trigger to notify developers immediately, enabling quick resolution of potential issues before users are affected. Real user monitoring provides insights into actual customer experiences. By embedding a small JavaScript snippet into your static files, you can automatically collect data from users' browsers. This allows you to track performance metrics, detect JavaScript errors, analyze latency issues, and determine where users are experiencing slowdowns down to their geographic location. Since synthetic monitoring and real user monitoring are integrated into a single system, there is no need to manage multiple services separately.
CloudWatch Container Insights
Observability is not limited to the application layer but extends to the infrastructure layer. A key challenge in modern architecture is bridging the gap between applications and infrastructure to gain a complete picture of system health. To address this, Application Signals is tightly integrated with CloudWatch Container Insights. If you run containers on Amazon EKS, ECS, or any other containerized environment, you can switch between Application Signals and Container Insights. For EKS users, enabling this feature is as simple as activating a CloudWatch add-on. Once enabled, telemetry data is automatically collected, providing deep visibility into both application and infrastructure performance in a unified manner.
Reference:
AWS Events
