Azure Sentinel is a Cloud-native, Born in cloud SIEM and a SOAR solution. I have discussed the Overview, Architecture, Connections, and features such as User entity behavior analytics, SOAR, and Pricing (here) from my previous blog post. I will start the initial implementation and connect a primary data source such as Azure AD to test the product from this post. Before implementing, consider the below points.
Basic Considerations
- It would help if you had an Azure subscription, and you can use the free tier of Azure Sentinel, which is 30 days free of charge.
- Log analytics workspace is required. Let's implement it from this post.
- Contributor permission required to the Azure subscription to enable Azure Sentinel
- Contributor or Reader permission is required to the Workspace that Sentinel belongs to.
- Try to use a single central Log Analytics workspace for Sentinel
- If you use multiple regional workspaces, it will increase the bandwidth cost. Also, make sure to connect Azure resources to the same region's Workspace.
Create Log Analytics Workspace
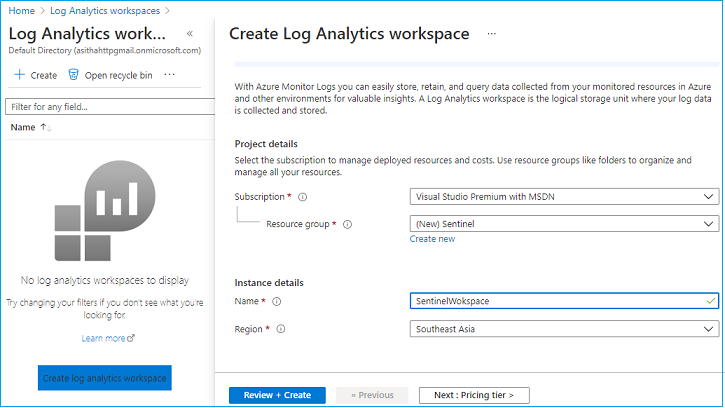
Before enabling Azure sentinel, you need to create a Log Analytics workspace for it. I prefer to have a dedicated one.
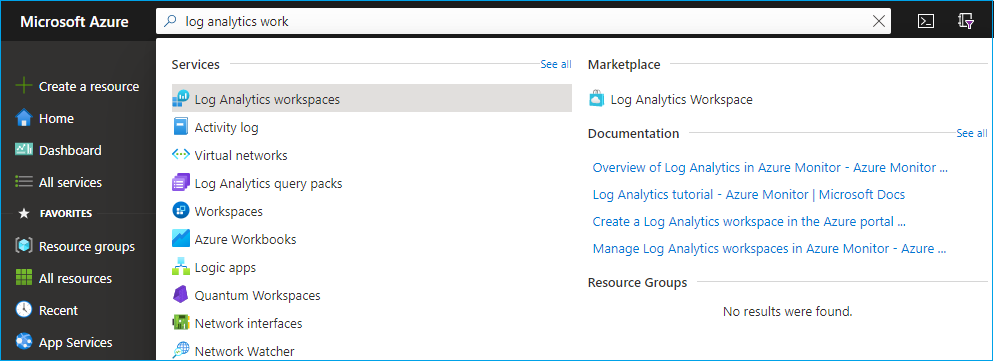
Login to Azure Portal, Type Log analytics workspace, and click Create
Enable Azure Sentinel
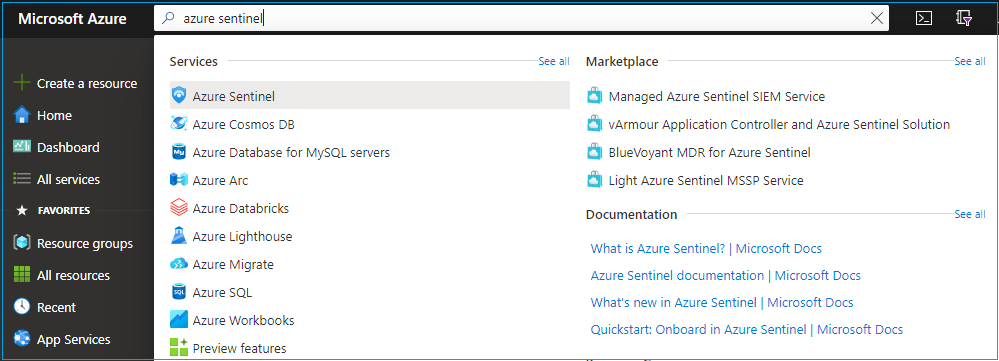
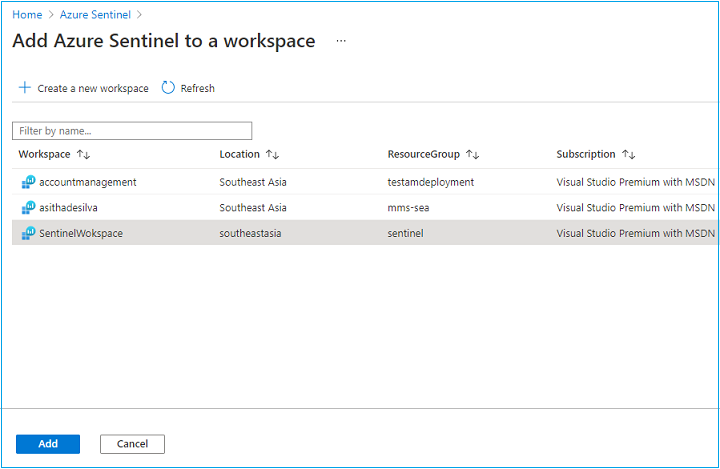
Enabling Azure sentinel is a simple task, Login to the Azure portal and search for Azure Sentinel.
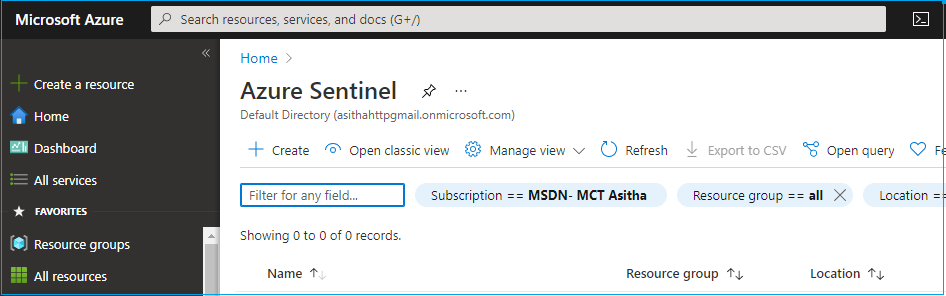
Select the Correct Workspace and click Add
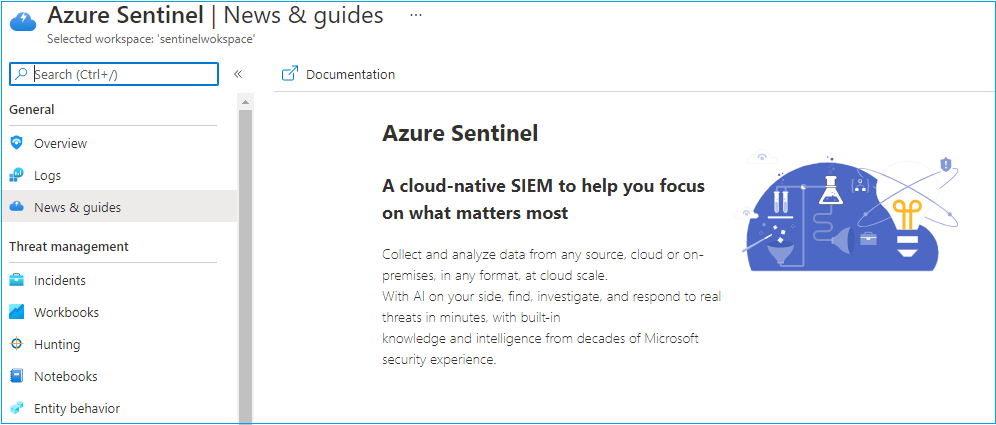
Then you can see the Azure Sentinel portal.
Configuring Data Connectors
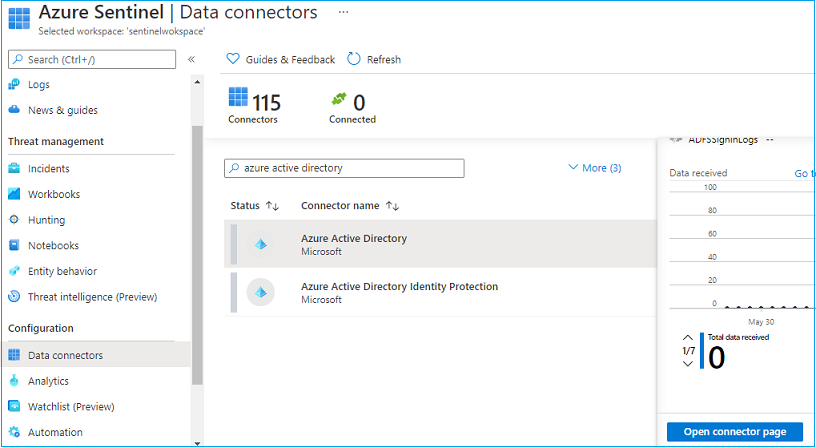
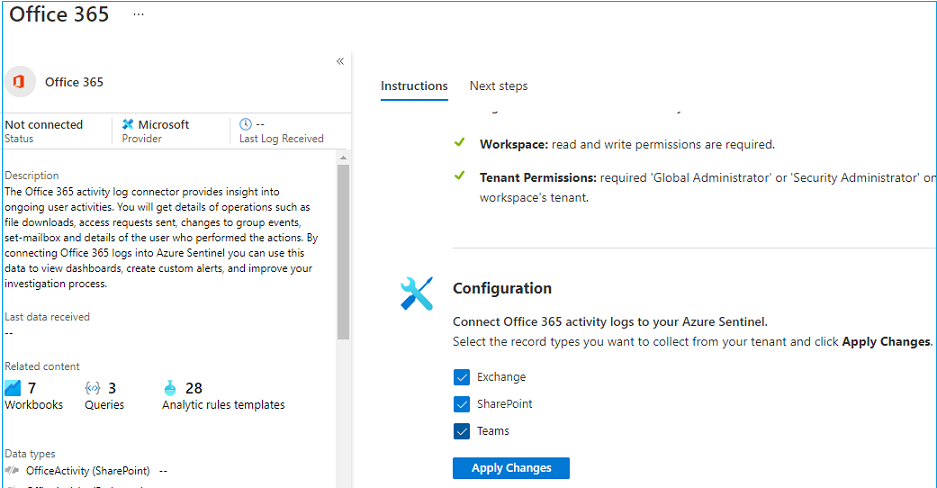
The next most important task is to connect your data sources. This will inject data into the sentinel platform. Here I’m configuring Azure Active Directory configuration, which is out a box service to service integration.
Type Azure Active Directory, Select, and click the Open Connector page.
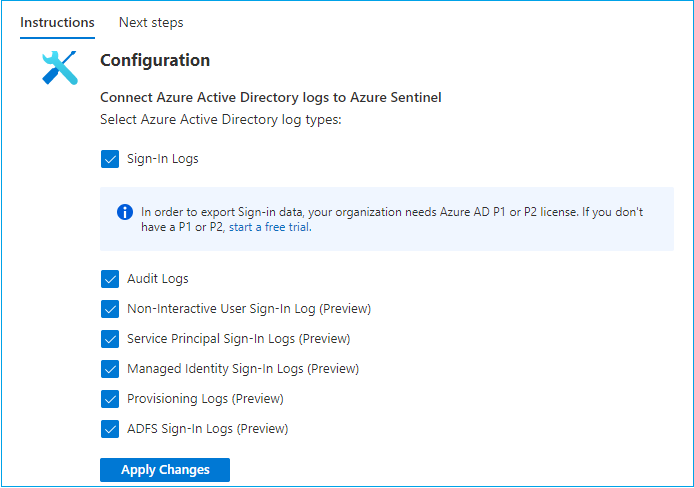
Select the required data logs and click Apply changes
Like this, you can select all other out-of-the-box solutions from the list, such as Office 365 solution.
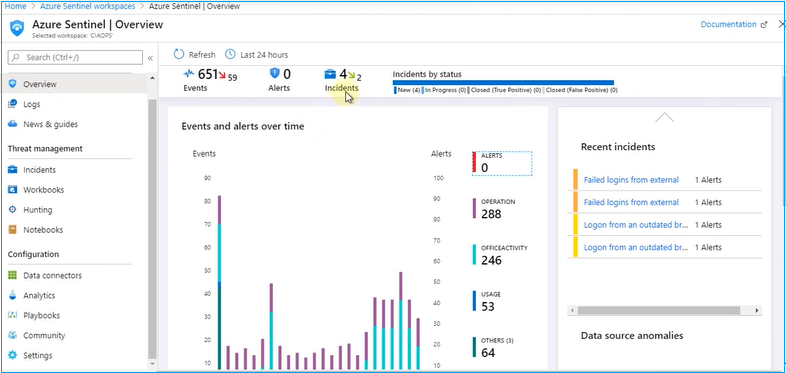
Data Visualization
After you configure the data sources, you can see data coming into the sentinel. When you click Overview, you can see the events and data collected.
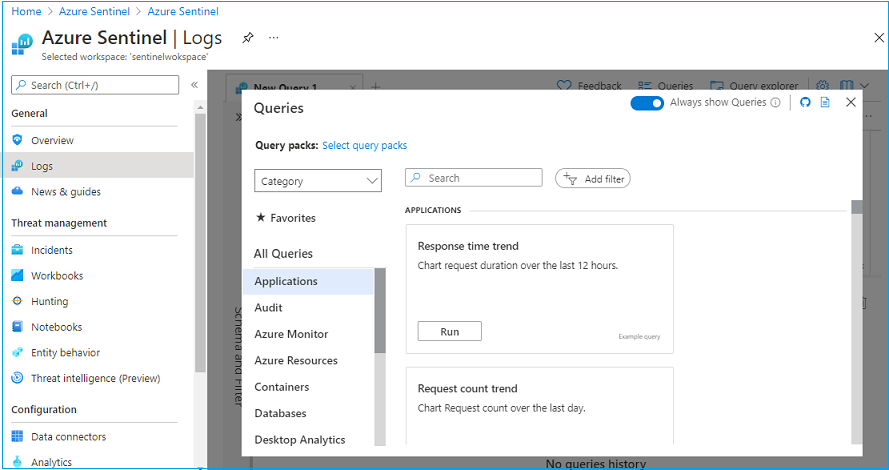
Logs windows are where you can use Kusto queries to retrieve and filter your relevant information. Kusto is the Microsoft log analytics query language that is used in the Azure platform.
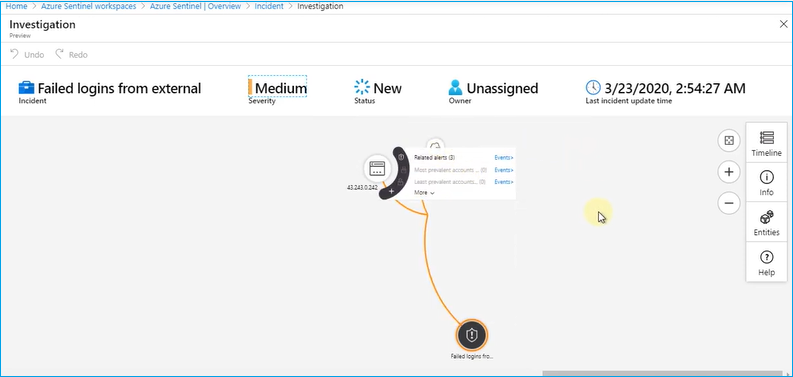
With these data, you can start an Investigation on Incidents. For example, if you have collected security events, you can investigate failed external logins, IP addresses, Locations, Device information and relate them in the investigation window.
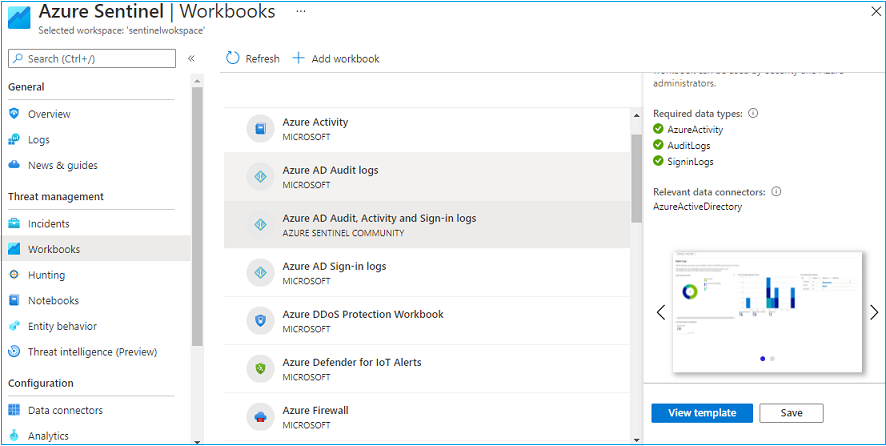
There are several built-in Workbooks available in Workbook’s window. You can click each and use them. The workbook is a pre-defined dashboard for specific workloads. It gives you a holistic view of each subject.
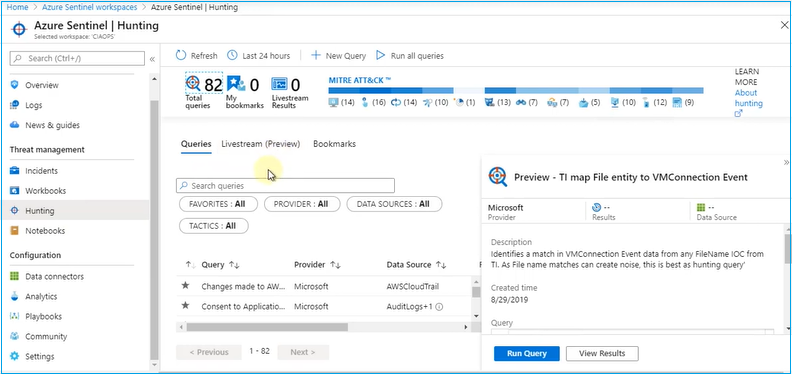
Finally, the Hunting visualization. It is to actively look for anomalies and find risks rather than waiting to get incident alerts into your sentinel dashboards. There are several queries and rules available to view the relevant information. You can also create your own custom rule and queries. Another nice feature is you can run all queries in one click and get the results to analyze.
That’s it for now. From the sentinel, I have covered basic installation and configuring data sources to visualize data. From the next posts, let’s discuss how we can monitor specific workloads such as Microsoft Defender.
I hope this post is useful.
Cheers
Asitha De Silva
