Windows Virtual desktop is a rapidly improving DAAS solution. While facing the pandemic situation, Windows virtual desktop solution helps to make Work from Home a reality. From this post, let's discuss how we can monitor Windows Virtual Desktop activities. Please refer to the links of my previous posts of WVD at the end of this article.
Some basic information in WVD can be monitored through Azure portal WVD blade and using PowerShell command lets. However, integrating with Azure log analytics and Azure monitor allow you to access deep-dive analytical data from log analytics queries or Azure monitor dashboards. Following are some examples of monitoring information.
- Session details such as connected users, duration, and their state
- Number of hosts, active users for each host
- Management and admin activities
- Hosts performance, CPU Memory, and Disk usage
- Errors on session connectivity, host issues
- User analytics such as the number of users connected the last 24 hours, last 7 days, their duration, peak time, etc.
Before monitoring, it is obvious you should have an up and running WVD environment, and you should have at least Monitoring Contributor, Log Analytics Contributor, and Security Administrator permissions access to all WVD components. I’m using Subscription owner to make things simpler. Let’s discuss everything related to WVD monitoring in the following manner.
- Create Azure Log Analytics workspace
- Integrate with WVD Components
- Deploy Log analytics agent from Azure monitor
- Configuring performance counters
- Deploy Azure WVD workbook
- Running custom queries from Azure monitor.
- Creating your own dashboard
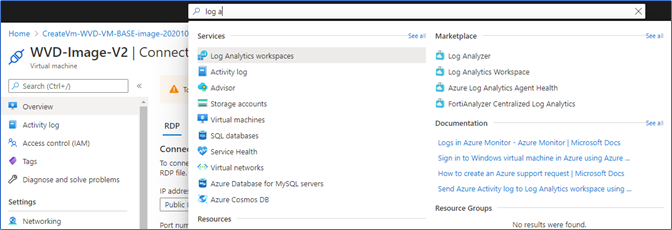
Create Azure Log Analytics Workspace
- Login to Azure.com and type Log analytics in the search area
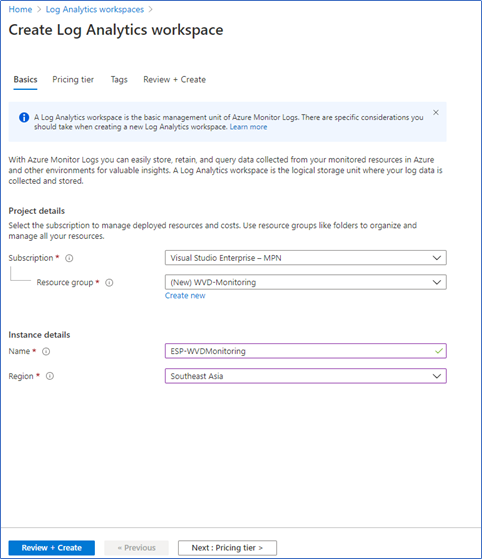
- Select Create Log analytics workspace and provide Resource group, Region, and Name for the workspace
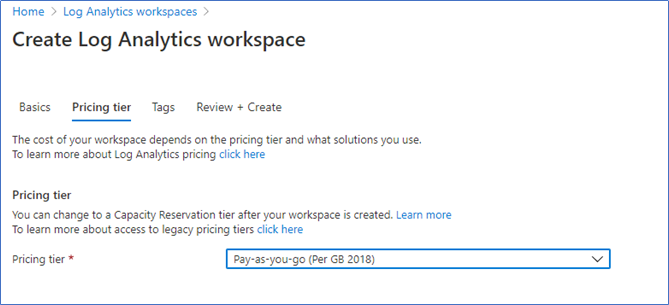
3. Select the pricing tier. Here I am using the Pay as you go model.
Integrate with WVD environment
In each WVD workspace, Host pool, and Application groups, you need to enable log collection and add the log analytics workspace in diagnostic settings.
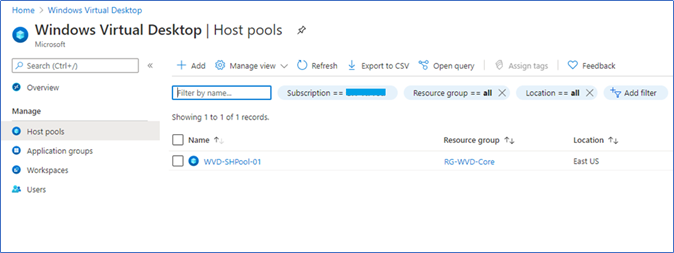
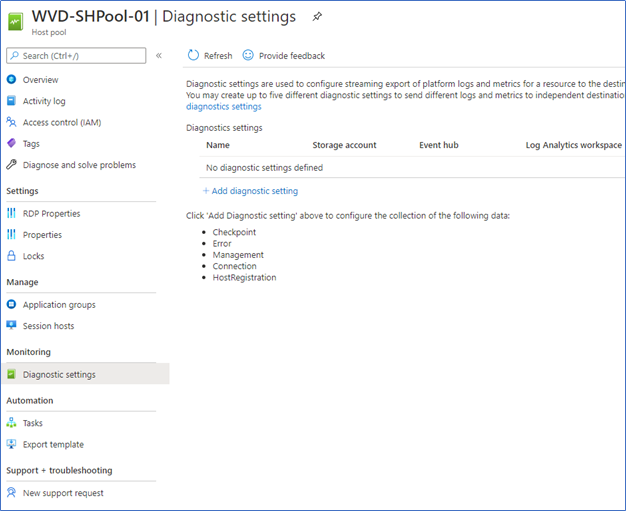
In Host pools
Click on the host pool to open its configurations.
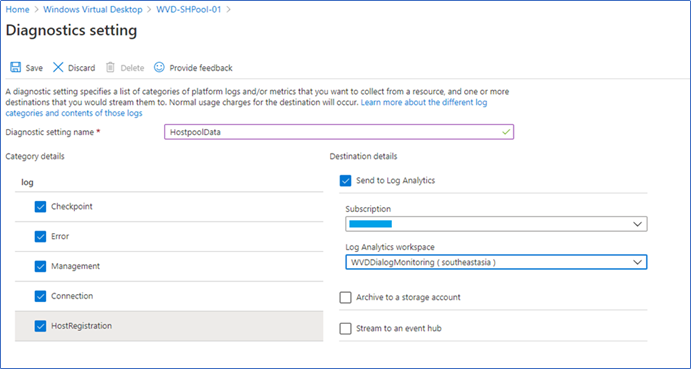
Click Diagnostic settings, and click +Add diagnostic setting.
Select all the logs, tick Send to Log Analytics and select your log analytics workspace from the drop-down list.
Application Groups
Redo the above steps on all the application groups
Select the Application group – diagnostic settings – Add Diagnostic settings, select all the logs and log analytics workspace
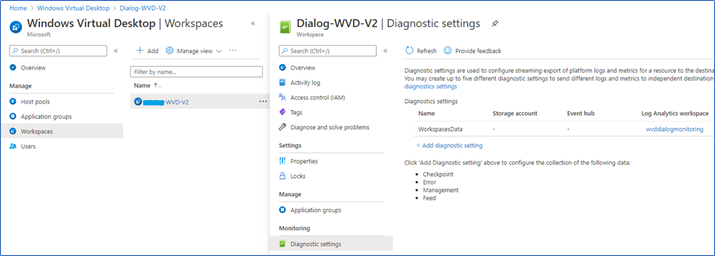
Workspaces
Redo the above steps on all the application groups
Select the Workspace – diagnostic settings – Add Diagnostic settings, select all the logs and log analytics workspace
Configuring Azure Monitor
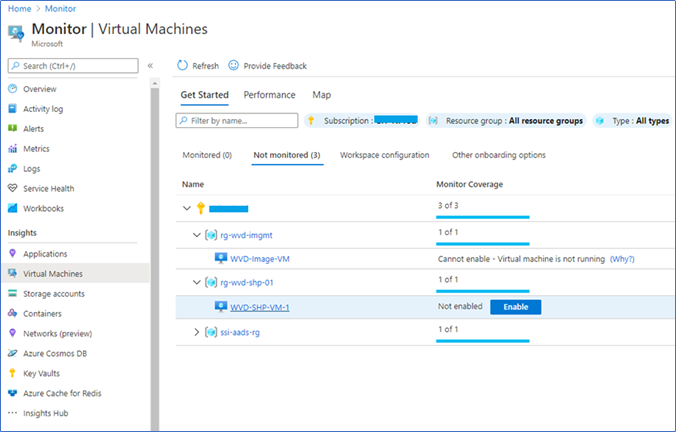
You need to enable each WVD VM host in Azure monitor to get advanced monitoring data. This will install log analytics agents on each WVD host. You can collect performance, events, and other relevant data into the Azure log analytics workspace.
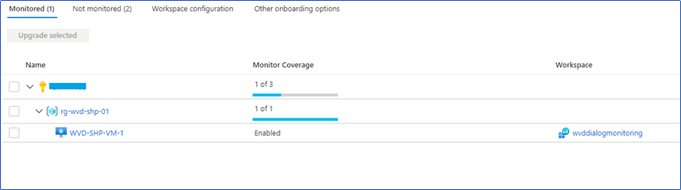
Log in to the Azure portal and search for Monitor to access Azure monitoring. In the Virtual machines, tab open Not monitored blade.
Click Enable on WVD VM’s
After agent installation, you can see these VM’s in the Monitoring blade.
Configuring performance counters
Next, you need to configure an advanced performance counter to monitor the VM’s, which are monitored through Log analytics.
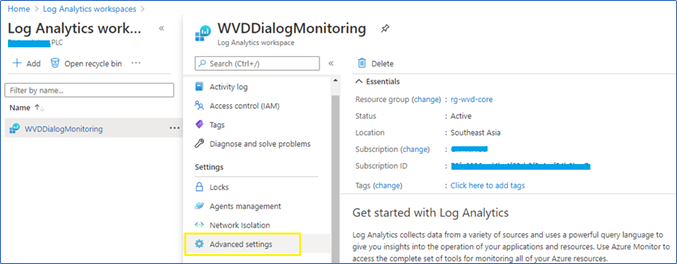
- Select the Log analytics workspace and click Advanced settings
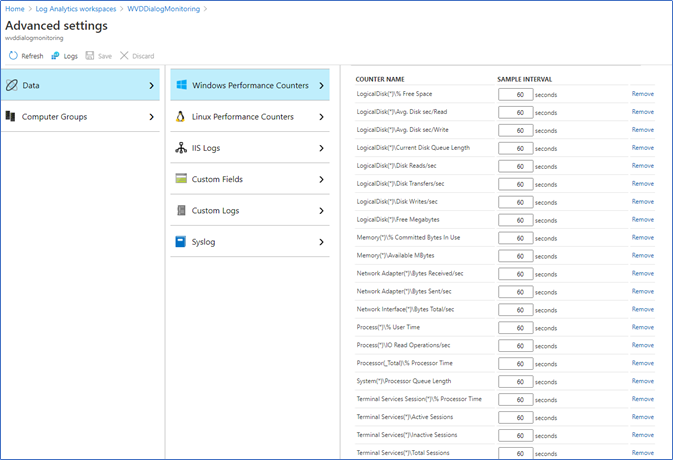
2. Click Data – Windows Performance counters and add the following
performance counters. Add batch by batch to avoid maximum event exceeds the message.
Batch Collection 1 |
Terminal Services Session(*)\% Processor Time |
Terminal Services(*)\Active Sessions |
Terminal Services(*)\Inactive Sessions |
Terminal Services(*)\Total Sessions |
LogicalDisk(*)\% Free Space |
LogicalDisk(*)\Avg. Disk sec/Read |
LogicalDisk(*)\Avg. Disk sec/Write |
LogicalDisk(*)\Current Disk Queue Length |
LogicalDisk(*)\Disk Reads/sec |
LogicalDisk(*)\Disk Transfers/sec |
LogicalDisk(*)\Disk Writes/sec |
LogicalDisk(*)\Free Megabytes |
Processor(_Total)\% Processor Time |
Memory(*)\% Committed Bytes In Use |
Network Adapter(*)\Bytes Received/sec |
Network Adapter(*)\Bytes Sent/sec |
Process(*)\% Processor Time |
Process(*)\% User Time |
Process(*)\IO Read Operations/sec |
Batch Collection 2 |
Process(*)\IO Write Operations/sec |
Process(*)\Thread Count |
Process(*)\Working Set |
RemoteFX Graphics(*)\Average Encoding Time |
RemoteFX Graphics(*)\Frames Skipped/Second - Insufficient Client Resources |
RemoteFX Graphics(*)\Frames Skipped/Second - Insufficient Network Resources |
RemoteFX Graphics(*)\Frames Skipped/Second - Insufficient Server Resources |
RemoteFX Network(*)\Current TCP Bandwidth |
RemoteFX Network(*)\Current TCP RTT |
RemoteFX Network(*)\Current UDP Bandwidth |
RemoteFX Network(*)\Current UDP RTT |
PhysicalDisk(*)\Avg. Disk Bytes/Read |
PhysicalDisk(*)\Avg. Disk Bytes/Write |
PhysicalDisk(*)\Avg. Disk sec/Write |
PhysicalDisk(*)\Avg. Disk sec/Read |
PhysicalDisk(*)\Avg. Disk Bytes/Transfer |
PhysicalDisk(*)\Avg. Disk sec/Transfer |
|
3. Set sample interval to 60 seconds to avoid unnecessary data gathering
Deploy Azure WVD workbook
There is a comprehensive WVD workbook released as a community contribution where you can download freely from GitHub. I have seen some third-party workbooks as well where you need to purchase. Let's see how we can implement the one in GitHub.
- Login to Azure portal – Azure Monitor
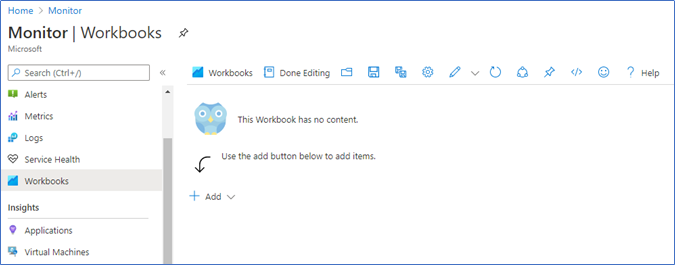
- Create a new Workbook from the Workbook tab
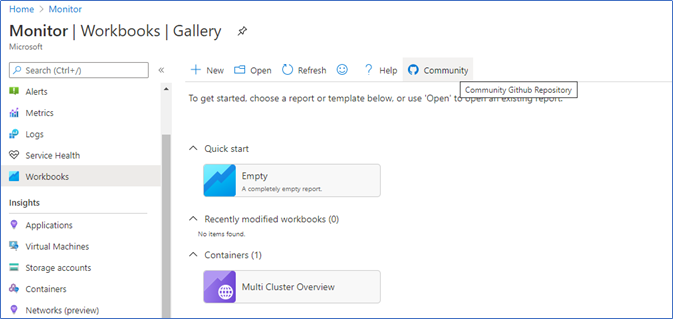
3. Click Code editor from top column - </>
4. Browse the following GitHub URL and click Raw to access the Code
https://github.com/wvdcommunity/AzureMonitor/blob/master/WVD-ARM-monitoring-workbook.json
5. Copy the entire code by using Ctrl + A and Copy
6. Delete the sample code and paste the entire copied code to the new workbook
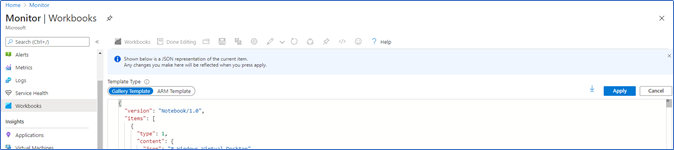
7. Click Apply and Done editing
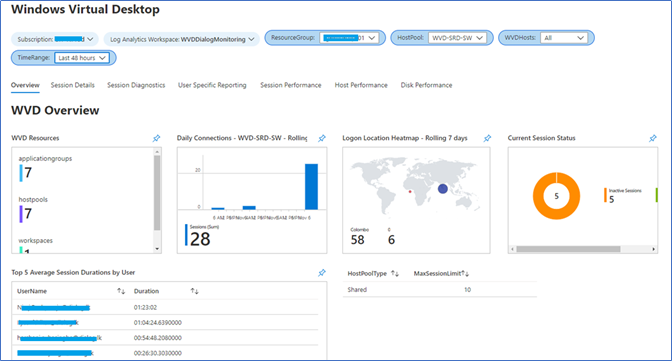
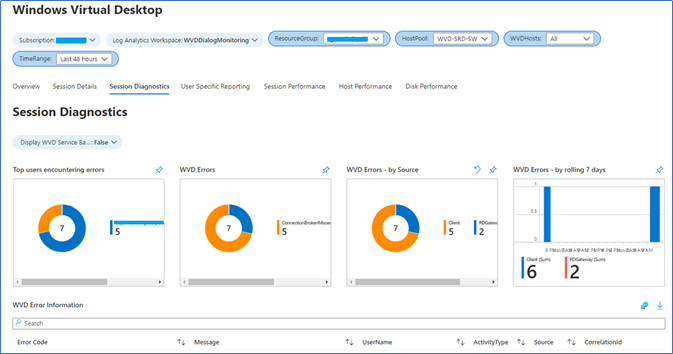
8. Go to the Azure Monitor – Workbooks – click the newly created workbook.
Running custom queries from Azure monitor.
I have used the above WVD workbook, but I always felt it is missing the most important information such as users active right now, the number of users connected to each host, user information, etc... Also, you need to switch the resource group and host pool to monitor its data. Using custom queries, you can access a wide variety of data exactly for your need. You can find queries, and writing them yourself is not that complex. Please refer to my sample queries
to start using queries Azure Monitor – Logs
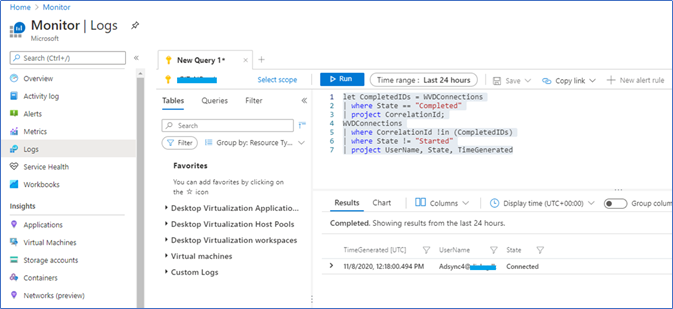
Sample Queries - Kusto
Active Users List
let CompletedIDs = WVDConnections
| where State == "Completed"
| project CorrelationId;
WVDConnections
| where CorrelationId !in (CompletedIDs)
| where State != "Started"
| project UserName, State, TimeGenerated
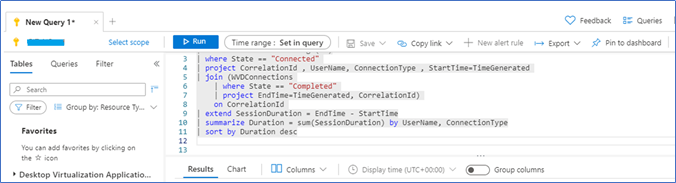
Users with their session duration – Last 7 days
WVDConnections
| where TimeGenerated > ago(7d)
| where State == "Connected"
| project CorrelationId , UserName, ConnectionType , StartTime=TimeGenerated
| join (WVDConnections
| where State == "Completed"
| project EndTime=TimeGenerated, CorrelationId)
on CorrelationId
| extend SessionDuration = EndTime - StartTime
| summarize Duration = sum(SessionDuration) by UserName, ConnectionType
| sort by Duration desc
Active sessions on Session Hosts
Perf
| where ObjectName == "Terminal Services"
| where CounterName == "Active Sessions"
| summarize arg_max(TimeGenerated, *) by Computer
| project Computer, CounterName, CounterValue
Session Information by date
WVDConnections
| where TimeGenerated > ago(7d)
| where State == "Connected"
| project CorrelationId , UserName, ConnectionType , StartTime=TimeGenerated, SessionHostName
| join (WVDConnections
| where State == "Completed"
| project EndTime=TimeGenerated, CorrelationId)
on CorrelationId
| project UserName,ConnectionType,StartTime,EndTime,SessionHostName
| sort by StartTime
Admin activities by time
WVDManagement
| summarize Count=count() by bin(TimeGenerated,15)
| render scatterchart
Host Performance – CPU
Perf
| where ObjectName == "Processor" and CounterName == "% Processor Time"
| summarize AggregatedValue = avg(CounterValue) by bin(TimeGenerated, 10m), Computer, InstanceName
Host Performance – Memory
Perf
| where ObjectName == "Memory" and CounterName == "% Committed Bytes In Use"
| summarize AggregatedValue = avg(CounterValue) by bin(TimeGenerated, 10m), Computer, InstanceName
Host Performance – Network
Perf
| where ObjectName == "Network Interface"
| summarize AggregatedValue = avg(CounterValue) by bin(TimeGenerated, 10m), Computer, InstanceName, CounterName
Host Performance – Disk
Perf
| where ObjectName == "LogicalDisk" and CounterName == "% Free Space"
| where InstanceName <> "_Total"
| summarize AggregatedValue = avg(CounterValue) by bin(TimeGenerated, 10m), Computer, InstanceName
Processor utilization per user:
Perf
| where ObjectName == "Process"
| join
(
VMProcess
| where UserName !contains "system" and UserName !contains "service"
| extend InstanceName = ExecutableName
| project TimeGenerated, InstanceName, Computer, UserName, UserDomain
)
on InstanceName
| summarize AggregatedValue = avg(CounterValue) by bin(TimeGenerated, 10m), InstanceName, CounterName, UserName, Computer
Failed Connections with details
WVDConnections
| where State =~ "Started" and Type =~"WVDConnections"
| extend Multi=split(_ResourceId, "/") | extend CState=iff(SessionHostOSVersion=="<>","Failure","Success")
| where CState =~"Failure"
| order by TimeGenerated desc
| where State =~ "Started" | extend Multi=split(_ResourceId, "/")
| project ResourceAlias, ResourceGroup=Multi[4], HostPool=Multi[8], SessionHostName ,UserName ,
CState=iff(SessionHostOSVersion=="<>","Failure","Success"), CorrelationId, TimeGenerated
| join kind= leftouter (
WVDErrors
) on CorrelationId
| extend DurationFromLogon=datetime_diff("Second",TimeGenerated1,TimeGenerated)
| project TimeStamp=TimeGenerated, DurationFromLogon, UserName, ResourceAlias ,SessionHost=SessionHostName ,
Source ,CodeSymbolic , ErrorMessage=Message, ErrorCode=Code, ErrorSource=Source ,ServiceError, CorrelationId
| order by TimeStamp desc
Creating your own Dashboard
Using these Kusto queries, you can create your own Azure Dashboard, which is useful in regular monitoring and assigning read-only access to monitoring teams to monitor.
Type your query in Azure Monitor Logs and tick Pin to Dashboard
Create a new dashboard and give a name
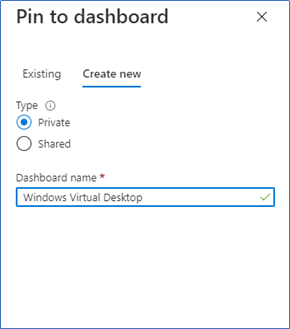
You can access your dashboard from Azure Dashboards and edit the tiles according to your priority.
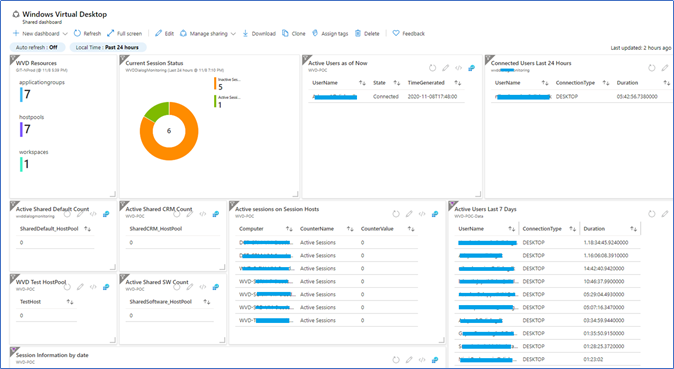
If you want more advanced dashboards, you can integrate the Log analytics workspace with PowerBI to visualize data.
Hope this post is useful
Refer to previous Windows Virtual Desktop articles
01 – Working remotely and efficiently with Microsoft technologies
02 - Windows Virtual Desktop | Configuring Prerequisites and WVD Tenant Creation
03 - Windows Virtual Desktop | Create Host Pool and Access through Web, Client App, and Mobile Devices
04 - Windows Virtual Desktop | Configure FSLogix User Profiles using Azure Files and AD Authentication.
05 - Windows Virtual Desktop | Manage App groups and Publish Applications
06 - Windows Virtual Desktop | 2020 ARM Version | Deployment with Domain Services
07 - Windows Virtual Desktop | Extra security with Multi-Factor Authentication
08- Windows Virtual Desktop | Shadow sessions
09-Windows Virtual Desktop | Image Management
Cheers
Asitha De Silva
